Shooting Statistics
Viewing Shooting Statistics
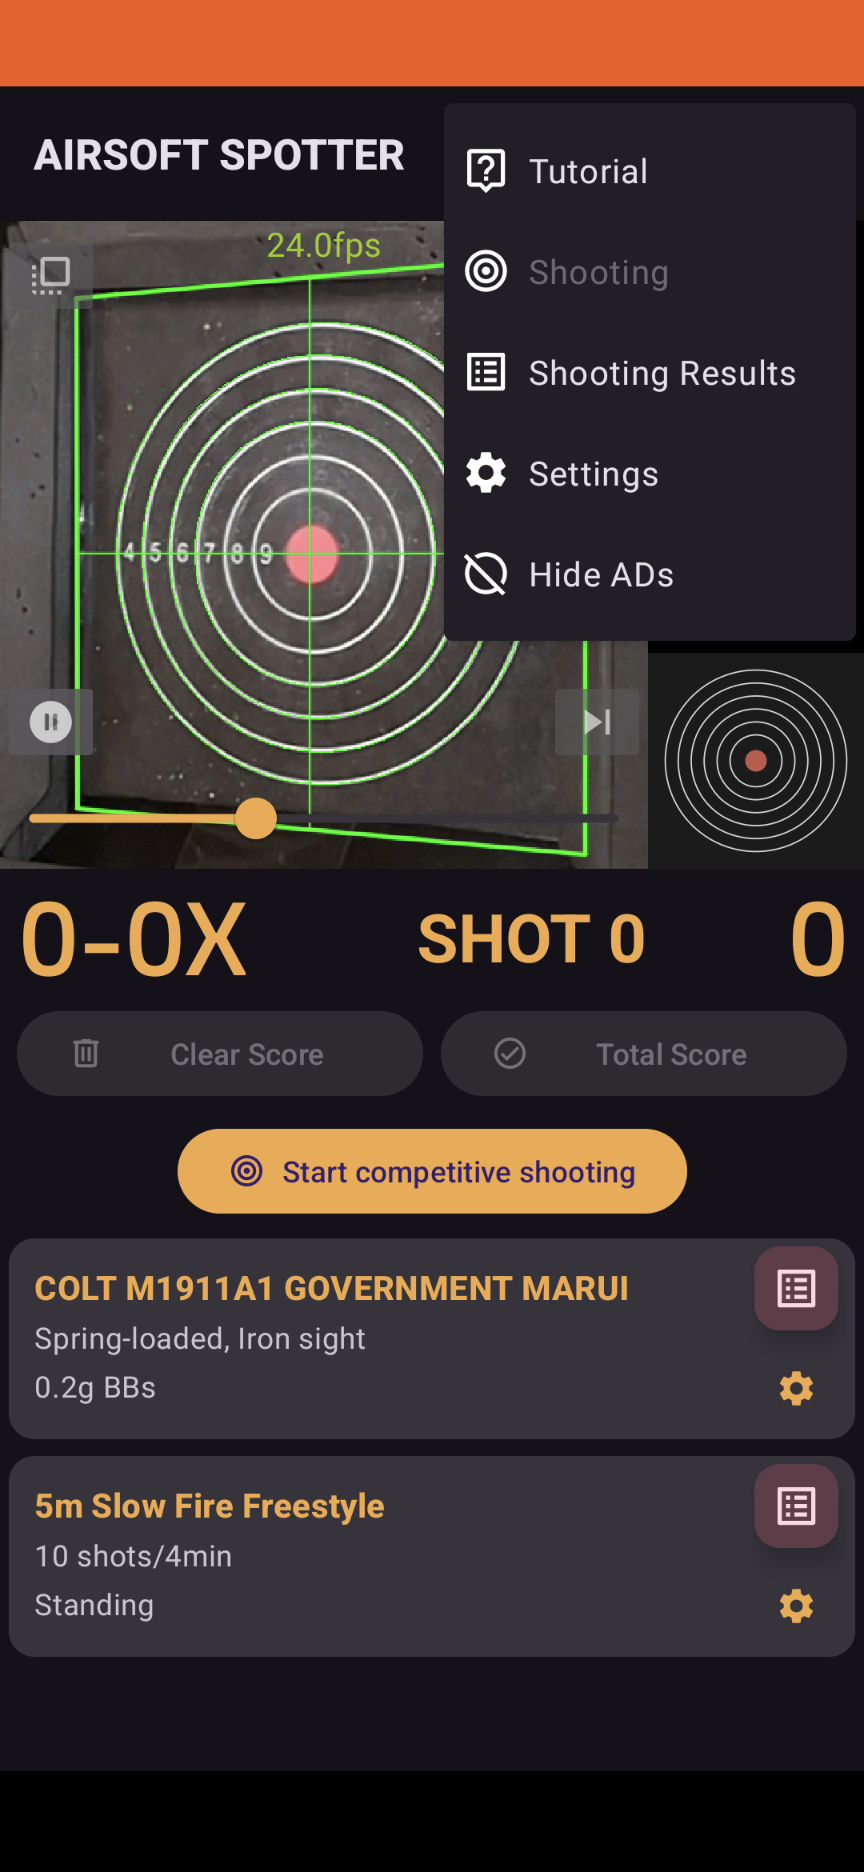
From the Main Menu
To view shooting statistics, tap the icon located at the top right of the screen to access the menu. From there, select Shooting Statistics.
From the Shooting Result Detail Screen
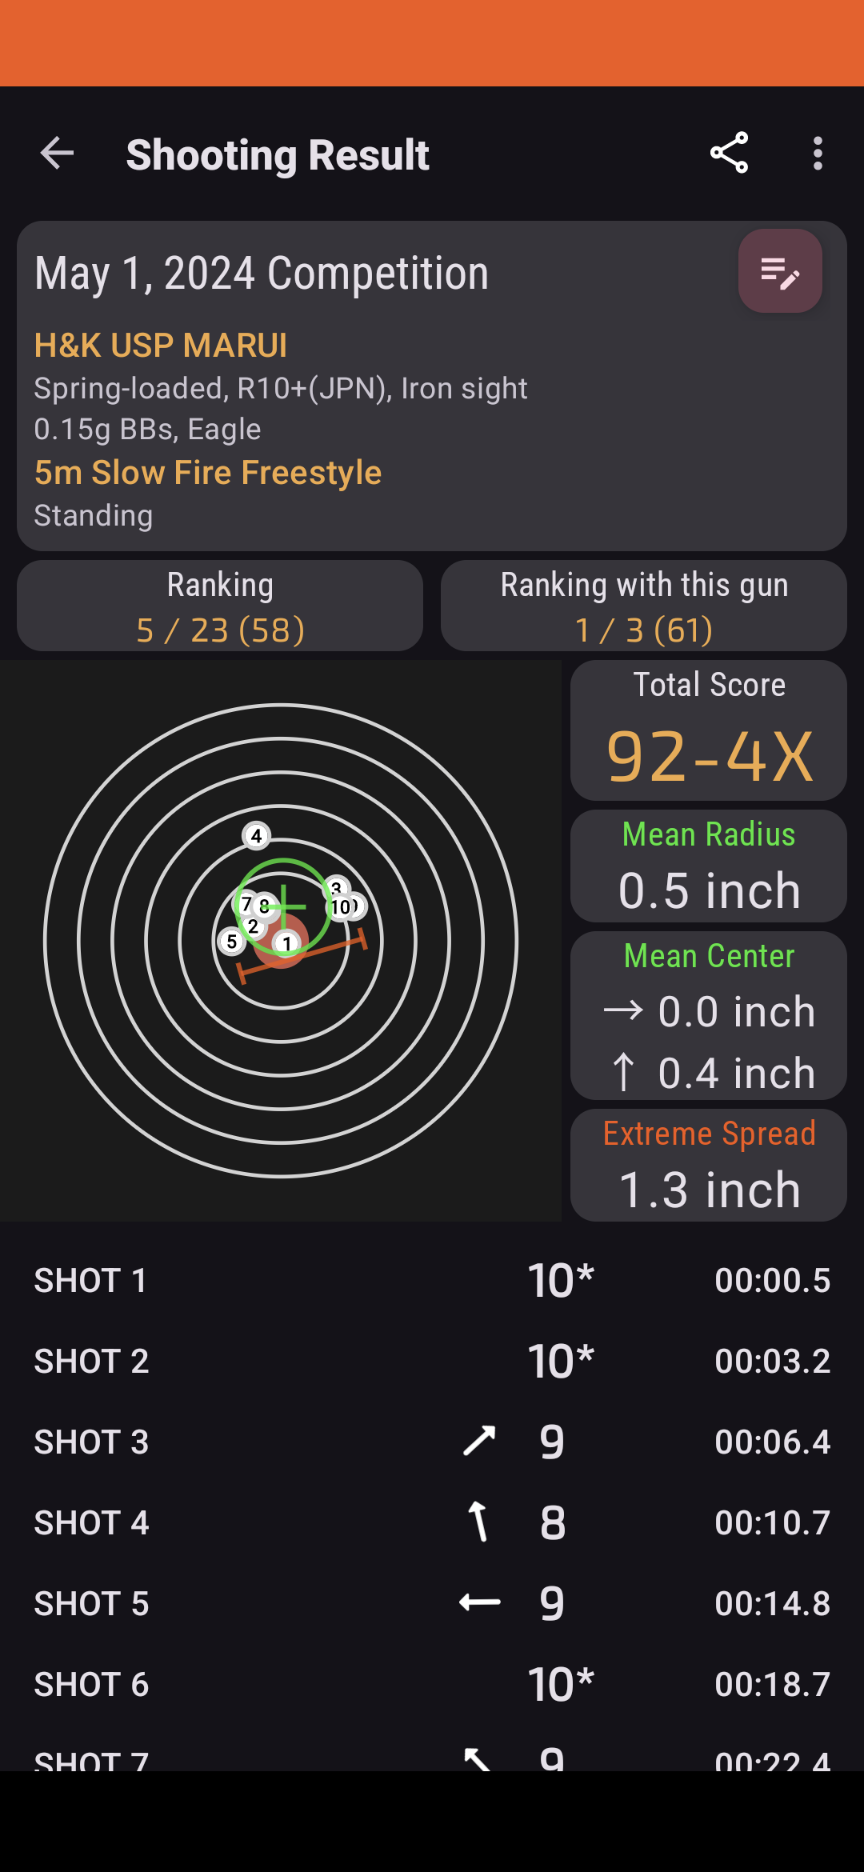
Tap the icon on the right side of the rank area to open shooting statistics for that competition rule.
Shooting Statistics Screen
History Chart
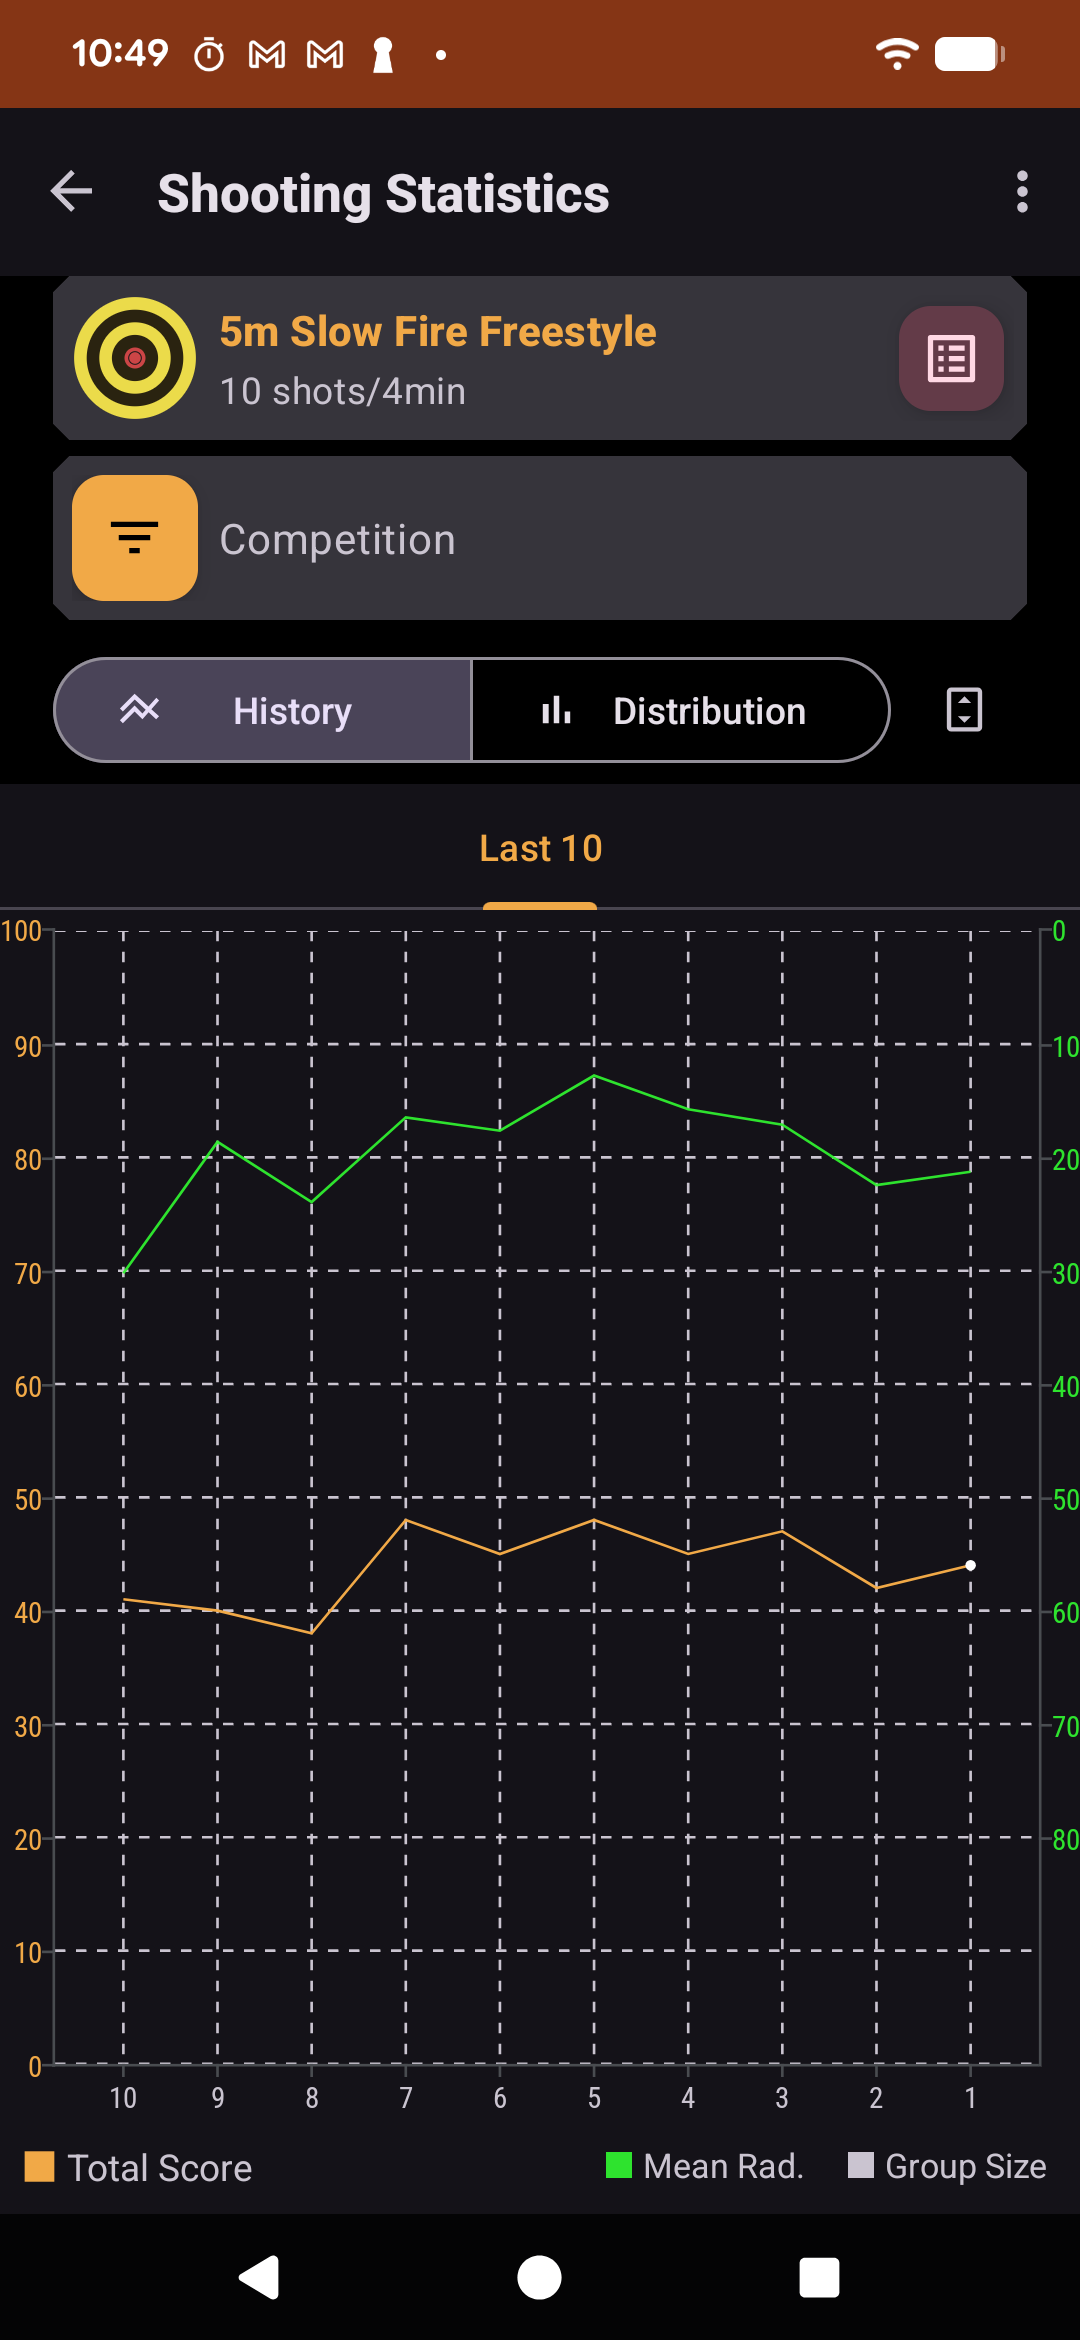
The history chart shows how your results change over time for the selected competition rule. Use it to check recent performance trends, such as whether your scores are improving, your times are getting faster, or your groupings are becoming more consistent.
Tap items such as "Average radius" or "Grouping" below the chart to switch the data shown on the right axis.
Distribution Chart
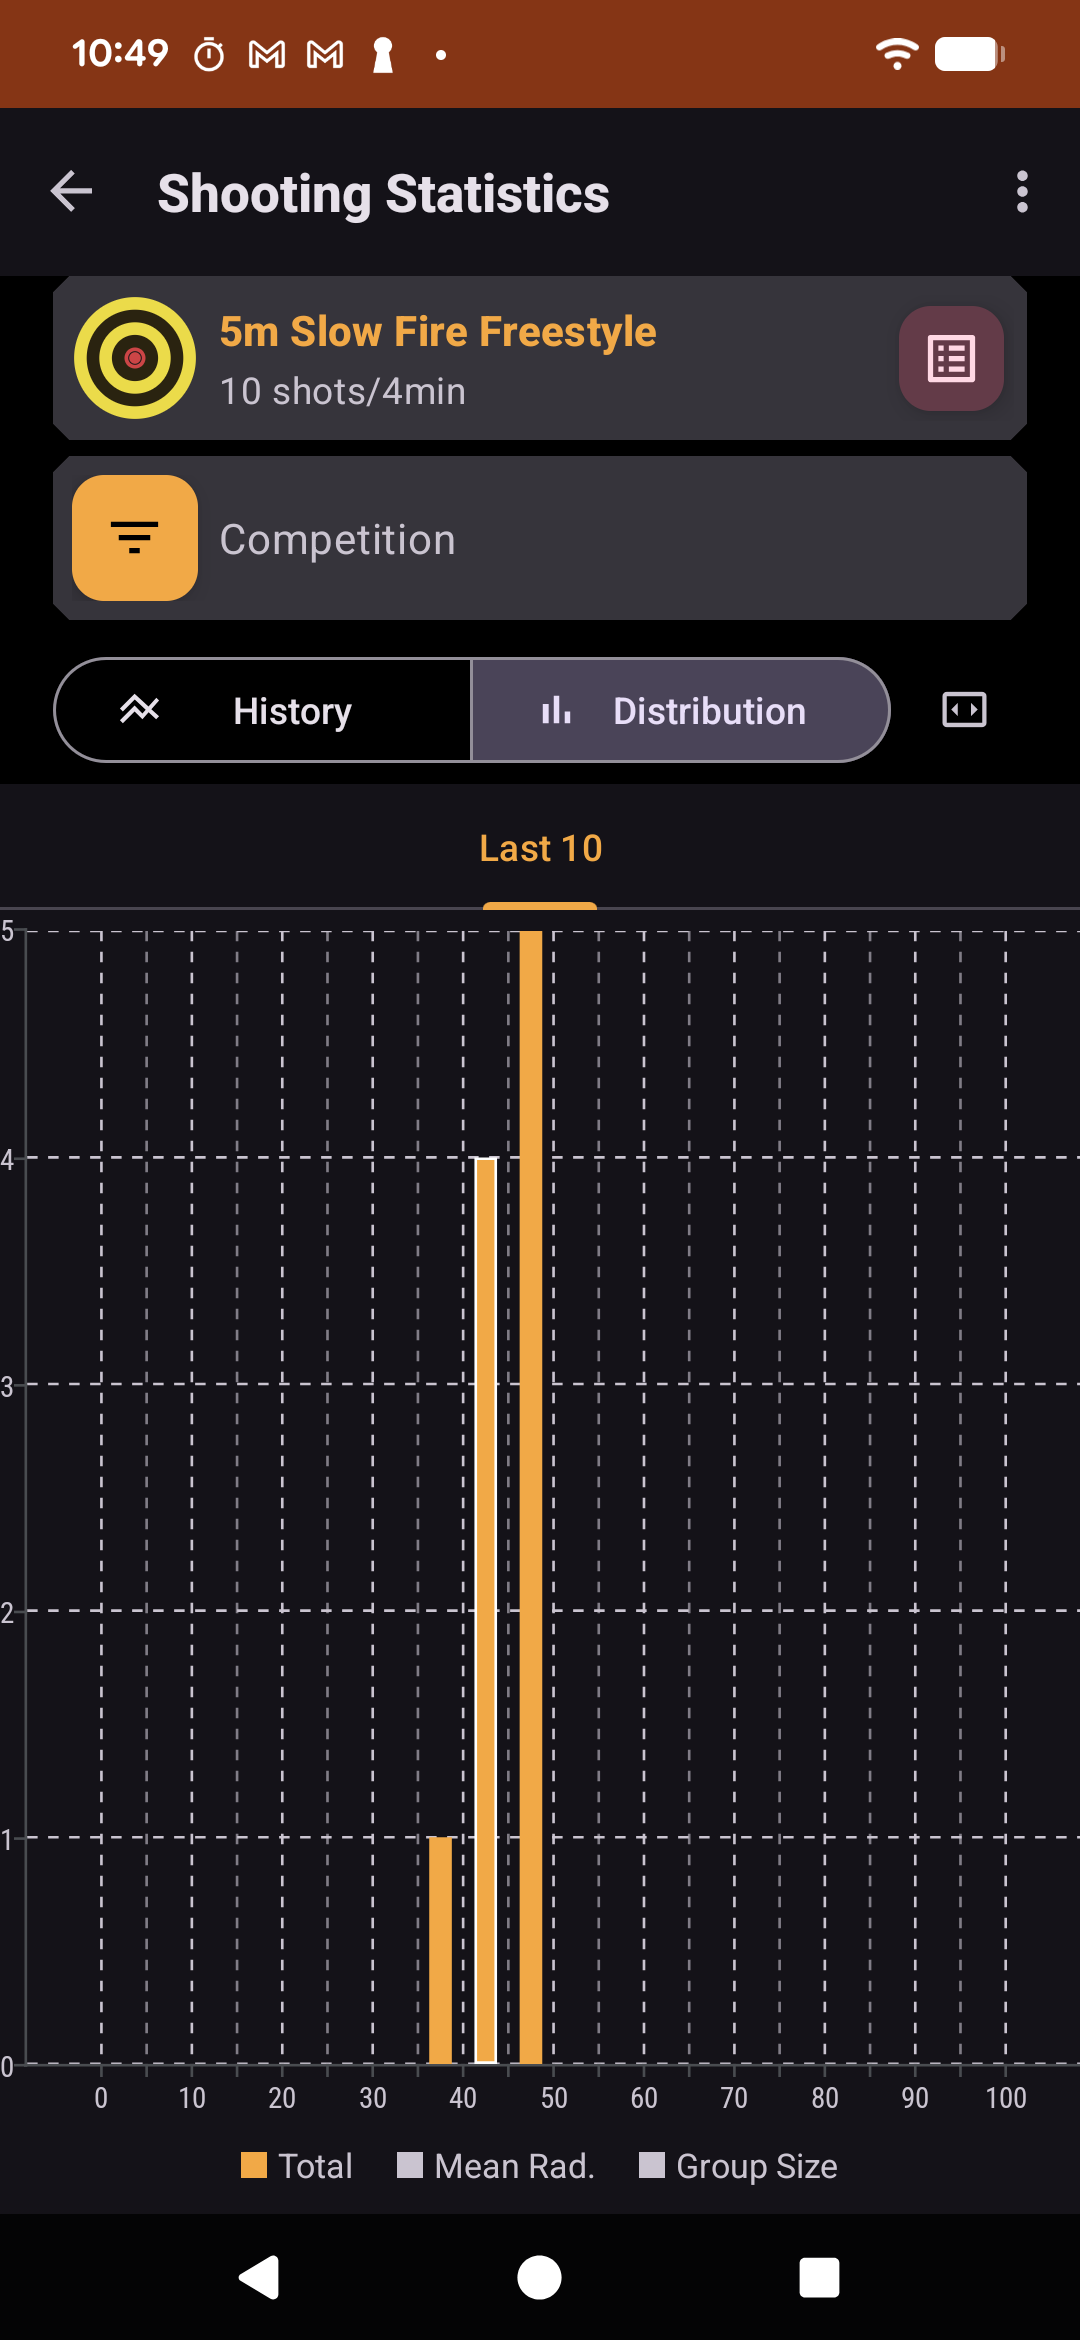
The distribution chart shows how often your results fall into each score, time, or measurement range. Use it to understand your usual performance range and see whether recent results are clustered tightly or spread out. This is useful for checking consistency, not just best records. A narrower distribution usually means your results are more stable.
Tap items such as "Average radius" or "Grouping" below the chart to switch the data used for the distribution.